

San Jose · Santa Clara County
San Jose gas prices
$5.95 / gal Regular average · 165 locations
How we compare prices
Regular gasoline only. We compare the city average today with its average yesterday and on the same date last month. Each average uses the available stations at that time, with prices no more than 36 hours old. The mix of stations and payment conditions can change, so this is an indicative city trend.
Yesterday: Oct 21, 2026: $5.981/gal, 143 locations. Last month: Sep 22, 2026: $5.790/gal, 10 locations. Cutoffs use the same local time in California; a shorter month uses its last day. Monthly comparisons need at least 3 stations on each date; daily comparisons need 12. Past averages are reconstructed from recorded observations.
Current city averages
A current price benchmark for San Jose
Median $5.90 · middle 80% $5.67–$6.29
165 station prices · observations from Oct 21, 2026 through 10/22/2026, 8:17:22 PM PDT
Median $6.16 · middle 80% $5.99–$6.50
75 station prices · observations from Oct 21, 2026 through 10/22/2026, 7:37:31 PM PDT
Median $6.38 · middle 80% $6.10–$6.70
88 station prices · observations from Oct 21, 2026 through 10/22/2026, 8:16:30 PM PDT
Median $8.67 · middle 80% $8.44–$9.00
46 station prices · observations from Oct 21, 2026 through 10/22/2026, 8:17:22 PM PDT
These planning averages use the latest eligible station price available in WorthStop data when the page was refreshed. Individual station timestamps vary and posted prices can change before arrival.
Source: WorthStop.Local driving guide
A large city at the south end of the Bay
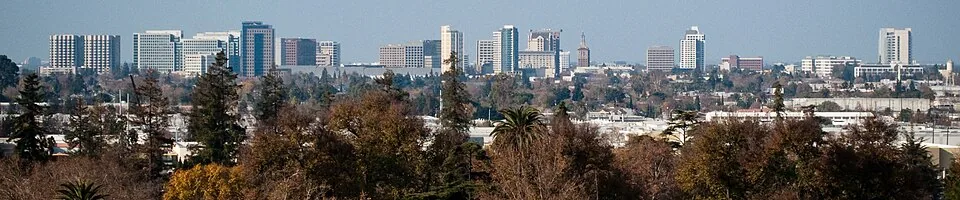

San Jose occupies a broad part of the Santa Clara Valley, rather than a single compact downtown. Its city price sample can therefore include stations that are far from the part of the city you are visiting. Treat the downtown skyline as a landmark, not as the automatic center of your fuel search.
Search from the address you need
Use the destination address for a work visit or neighborhood errand. When comparing San Jose with nearby Silicon Valley cities, keep the same vehicle, fuel grade and gallons so that a change in route does not get mistaken for a better pump price.
Our local data
What WorthStop covers in San Jose
- Fuel locations in our catalog
- 241
- Locations in the Regular-price benchmark
- 165
Catalog locations and recent price observations are different measures. Records here use the San Jose city address label; this is not a census of every station within the municipal boundary. Separately named neighborhoods may appear on their own pages.
- 164 with store information
- 63 with food information
- 37 with recorded opening hours
Missing details mean unknown information, not that a service is absent. Recorded amenities and hours can change. Known restricted sites are excluded from this catalog count; access at other sites may still be unconfirmed. Check the individual location before traveling.
Read our data methodologySan Jose and Santa Clara County
Santa Clara County Regular average: $5.98 per gallon, from 339 station prices.
The city average is $0.03 per gallon below this benchmark. Broader samples can include this city's stations; these are overlapping geographic benchmarks, not separate competing offers.
San Jose and San Francisco Bay Area
San Francisco Bay Area Regular average: $6.05 per gallon, from 1434 station prices.
The city average is $0.10 per gallon below this benchmark. Broader samples can include this city's stations; these are overlapping geographic benchmarks, not separate competing offers.
How San Jose compares
The current regular average is $0.10 per gallon below the California average.
The middle 80% of current regular prices spans $5.67 to $6.29, a $0.62 per-gallon range.
What that spread means
Across a 10-gallon purchase, the current 10th-to-90th percentile difference is about $6.20 before accounting for detour fuel and time.
Why your route still matters
A city average cannot identify the stop worth making. WorthStop ranks eligible stops for the route using the selected fuel grade, gallons, vehicle MPG and extra driving required.